
The Insiders Fund doesn’t buy index funds as a rule unless to hedge a long portfolio or participate in a broad trend that we need quick exposure to. That doesn’t mean that insiders are immune from market routs like we are experiencing but generally insiders buy their stocks after they have had a rout of their own. The proliferation of index investing and quantitative hedge funds has created an increasingly correlated market. Investors are basically making one decision when they buy an index fund like the popular SPY -SPDR S&P 500 Trust ETF. This begets an important question, what is the SPY worth.
One popular way of evaluating value that works exceptionally well for a basket of stocks like S&P 500 is the dividend discount model. The dividend discount model (DDM) is a method of valuing a company’s stock price based on the theory that its stock is worth the sum of all of its future dividend payments, discounted back to their present value.[1] In other words, it is used to value stocks based on the net present value of the future dividends. The equation most widely used is called the Gordon growth model (GGM).
The variables are: is the current stock price. is the constant growth rate in perpetuity expected for the dividends. is the constant cost of equity capital for that company. D is the value of the next year’s dividends.


The S&P 500 closed Friday at 2,599.95. The real dividends paid as of September was $52.26. That’s a current yield of 2.0%. Dividends are easy to measure unlike other financial ratios which are distorted by a number of things like Non GAAP adjusted earnings. According to http://www.multpl.com/s-p-500-dividend-growth the average rate of dividend growth is:
Current S&P 500 Dividend Growth: 8.65%
| Mean: | 5.94% | |
| Median: | 6.37% | |
| Min: | -21.07% | (Dec 2009) |
| Max: | 18.25% | (Dec 2012) |
But let’s say that companies may retreat a little and only raise dividends the historical norm next year, 5.94%. That would create a dividend of $55.36. From there its a simple calculation. The cost of equity capital through the years has been around 7.5%. Based on that the S&P 500 should be about 1006.55., a 61% drop from where it currently is, quite a horrible outcome for equity investors.
Perhaps this is not a very good measure of the value of the S&P 500 index since recently it has become heavily weighted toward technology, almost 25% of the S&P now, and many of these companies pay no dividends. The S&P 500 index is a capitalization weighted index and 5 of the top ten constituents pay no dividends.
Top 10 by Index Weight
| Constituent | Symbol | Sector* |
|---|---|---|
| Microsoft Corp | MSFT | Information Technology |
| Apple Inc. | AAPL | Information Technology |
| Amazon.com Inc | AMZN | Consumer Discretionary |
| Berkshire Hathaway B | BRK.B | Financials |
| Johnson & Johnson | JNJ | Health Care |
| JP Morgan Chase & Co | JPM | Financials |
| Facebook Inc A | FB | Communication Services |
| Alphabet Inc C | GOOG | Communication Services |
| Exxon Mobil Corp | XOM | Energy |
| Alphabet Inc A | GOOGL | Communication Services |
If the S&P 500 were to revert to its historical average price-to-earnings ratio, the current S&P 500 dividend yield would be 2.8%, An average yield in the range of 2.5% to 3.0%. That would equate to an S&P 500 of 1977, still an awful outcome, a drop of around 23.9%. Coincidentally perhaps but that’s pretty close to the 2197 of the S&P the day before Trump won the Presidency.
Another popular measure of valuation is the Schiller P.E ratio. The outlook from this model is equally dismal.
Current Shiller PE Ratio: 28.78 -0.56 (-1.92%)
| Mean: | 16.59 | |
| Median: | 15.69 | |
| Min: | 4.78 | (Dec 1920) |
| Max: | 44.19 | (Dec 1999) |
As of September the S&P was earning $130.18. The Shiller mean P.E would put the S&P at 2159, extremely close to the day before Trump won the election. As of 12-14-18, the Wall St. Journal reported the P.E. multiple of the S&P 500 was 20.19. But as you can see from this chart, P.E. ratios can vary wildly, as much as fashions in dress styles.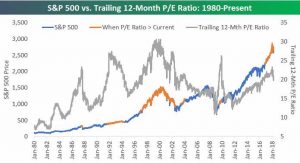
So the bottom line is we don’t pretend to know where the S&P should trade at but one thing is clear to us is that all market routs for the last thirty years have ended when insiders as a group step up and buy their own company stock. As you can tell from this chart courtesy of the Washington Group, we are not there yet but insiders are stepping up their purchases.
