
The Insiders Fund is having a relatively impressive year, 12% points better than the S&P 500. While still down about 2% for the year, I’m convinced that we are close to running the table. Why do I have this confidence?
After more than twenty years of studying insider buying patterns, the safest and most reliable indicator of market bottoms is the insider buy/sell ratio. The proof is in the charts I am sharing here.
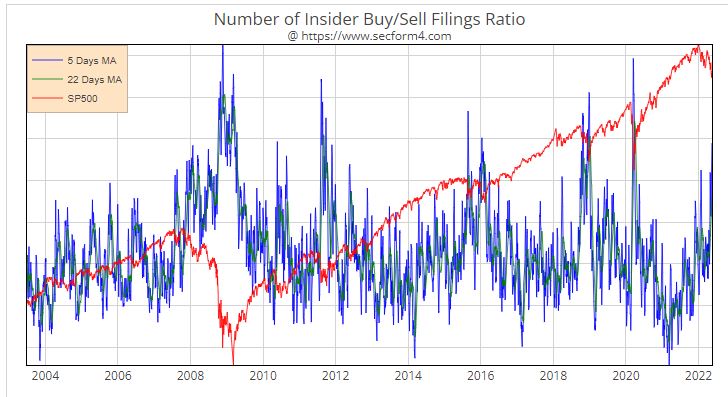
Generational Buying Opportunites S&P 500
The blue/green line (insider buying) is rarely above the red line (the market). After all, insiders are natural sellers with so much of their compensation attached to their stock. The higher the blue/green lines, the more buying versus selling. During the Fall of 2008 and into the Spring of 2009 insiders were furious buyers of their own stock. The other was that stocks were no longer going down on disappointing earnings. This convinced me in the Spring of 2009 that the rout was over. Another obvious generational buying opportunity in hindsight was the Spring of 2020.

Short Term Buying Opportunites Nasdaq
Nasdaq has declined over 20%, the definition of a bear market. Many Nasdaq stocks have declined more than 50%. The redline is the Nasdaq market index. The blue/green line (insider buying has crossed it for the first time since March of 2020.
Insiders are like radar revealing buying opportunities that are not apparent to the naked eye. This goes a long way to explaining how over longer periods of time, since 2001, this strategy has contributed to outperforming the S&P 500 by over 670%. We’re getting closer to that short-term buying opportunity. Maybe it’s already here in the ruins of the Nasdaq.
[…] 6.19% for the week. So is this the all-clear sign? We wrote last week a Temporary Truce in the Alpha War Zone that the insider buying sell ratio in the NASDAQ stocks looked like it had reached a short-term buy […]