
One of the tools I regularly use to preserve gains and especially long-term capital gains is writing covered calls on positions that I think can do down in the near term. Technical analysis is a great tool to predict short-term price movements. Take the example of Crown Castle Internationa. Crown Castle is a real estate investment trust and provider of shared communications infrastructure in the United States. Its network includes over 40,000 cell towers and nearly 80,000 route miles of fiber supporting small cells and fiber solutions. Wikipedia
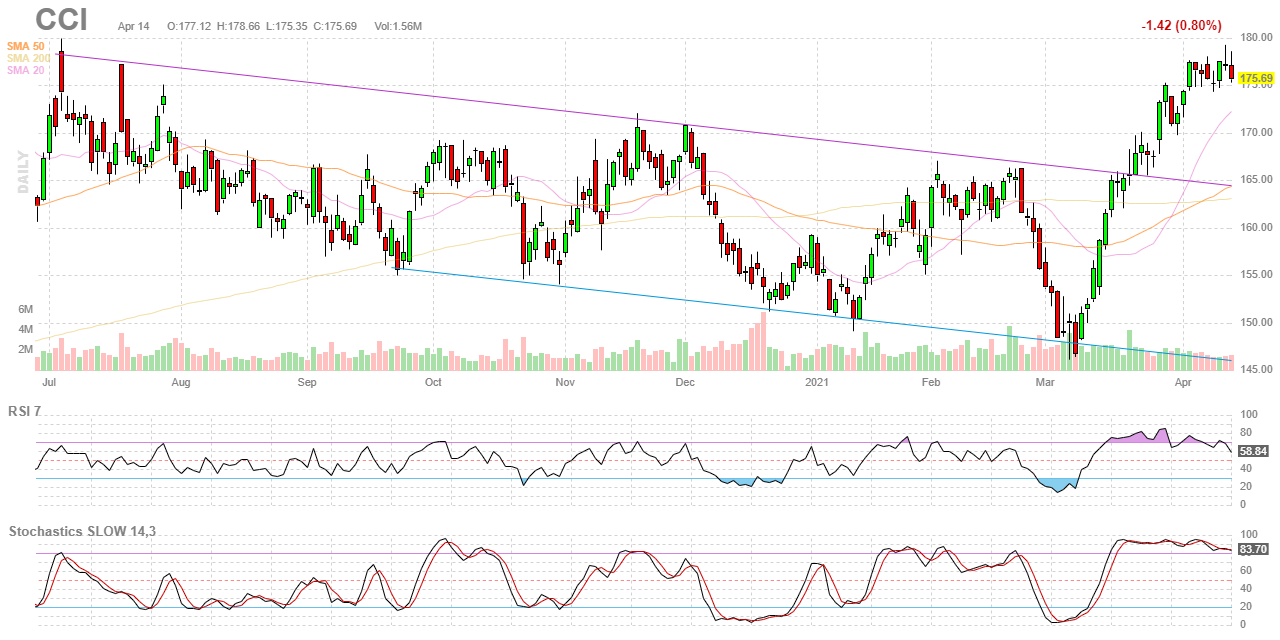
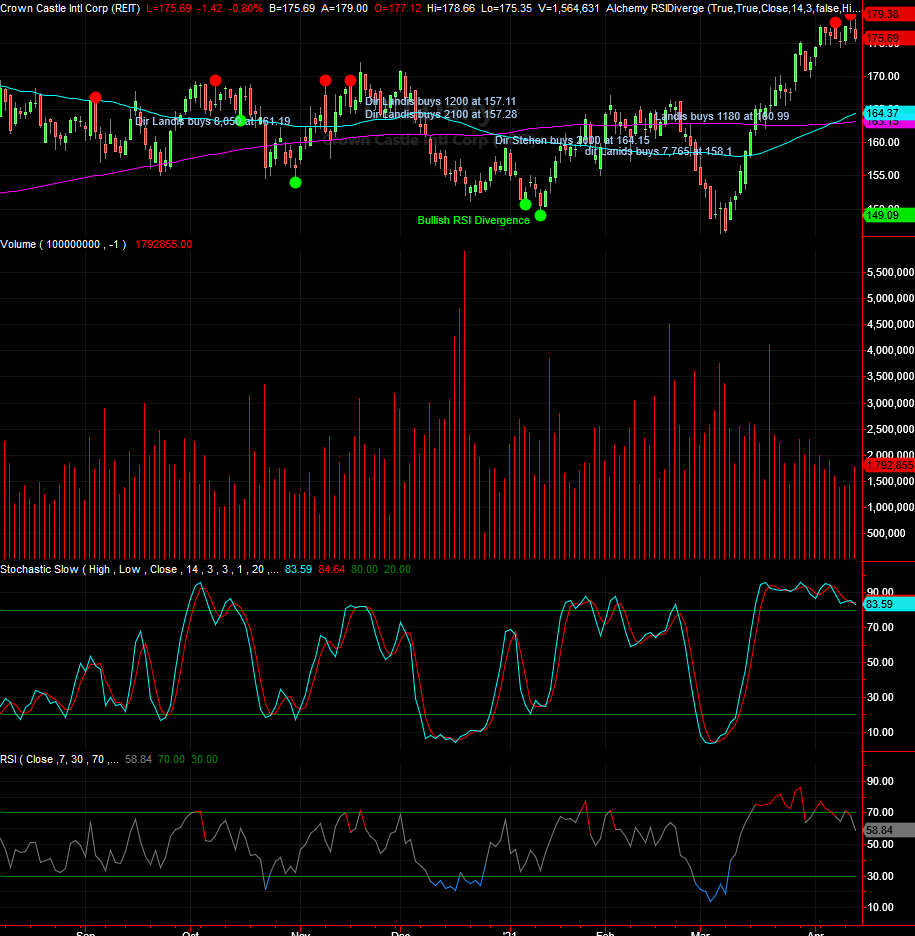
CCI has got most of the ingredients we want for a low-risk equity play. As you can see from the chart above CCI has strong near-term relative strength, outperforming the S&P 500 by 5.67% over the last 4 weeks and 6.67% over the last 13 weeks. It also has strong insider sponsorship with two directors buying over $1.7 million worth of stock this year. We know that the rollout of 5G cellular towers is transformational and there is likely to be even more stimulus dollars to enable rural broadband and inner-city broadband internet, all positive things for the business backdrop. Crown Castle has been the subject of favorable Barron’s articles in January, Infrastructure Stocks and Funds Offer Solid Dividend Yields. Here’s Where to Look.
Yet there are some clouds on the horizon. For example, the CFO sold 5000 shares on 3/9/21 for $150.72, nearly $25 below today’s closing price of $175.69. Most worrisome though for traders is the RSI divergence sell signal. One of the signals we pay most attention to is when when Wilder’s Relative Strength diverges from the underlying stock. Most technical indicators just smooth out stock price patterns and make it easier to detect trends. Divergence signals a trend change, just like the name implieds. Think of it as an early warning system. We are seeing a very clear bearish divergence signal on CCI. The red dots on the chart are sell signals our software is painting on the stock chart. Look at the very bottom line on this chart. It is clearly headed down. You can blow these charts up for easier viewing by clicking on them.
We have successfully traded CCI now for months collecting a healthy 3.5% dividend along the way but it might be time to leave the playing field before our welcome runs out. One way of doing this is by writing covered calls on a position to preserve some gains and avoid the tax burden from selling. We wrote the April 70 calls some time ago for a $2.05 premium. If we buy them back before Friday, expiration day we will lose money on the option trade. If we buy them back at a premium and the stock drops we lose money on the options and the stock. It would be better to just sell the stock. Yet if we sell the stock we lock ourselves into paying taxes on the sizeable gains that we have. If I am very convinced that CCI will go down before the expiration date, I’m better off just leaving it alone, and on expiration day if it is at risk of getting called away, I can just buy back the options rather than lose the stock and have taxes to pay. There are a number of options strategies I can do from buying puts, delta hedging, or selling more calls than I have underlying stock to cover. It’s always a hard call but usually an easier one in hindsight. It’s better to preserve profits and pay taxes than risk losing it. CCI is at the top of its upward range and has strong support at $170.
The following is a good explanation of the RSI indicator.
The Relative Strength Index (RSI) was first developed by renowned technical analyst J. Welles Wilder. It is not to be confused with relative strength, which compares a stock’s price performance to that of an overall market average, such as the S&P 500. Instead, the RSI analyzes the recent performance of a security in relation to its own price history.
RSI is a valuable tool to determine overbought/oversold levels.
There are five major principles of RSI analysis:
1) When RSI goes above 70 or below 30, it indicates that a stock is overbought or oversold and vulnerable to a trend reversal.
2) A reversal often occurs after bullish or bearish divergence. Bearish divergence takes place when the stock breaks out to a new high, while RSI makes a lower high. Bullish divergence occurs when a stock makes a fresh new low, while RSI sets a higher low.
3) An RSI failure swing provides a trading signal. A bearish failure swing occurs when RSI peaks above 70, goes below that level, tests the first peak, fails, and breaks support on the RSI chart. The bullish failure swing is the reverse.
4) RSI forms patterns, such as triangles or head and shoulders tops and bottoms. Breakouts from these patterns on the daily chart often precede the price breakout by one or two days — providing the swing trader valuable advance notice.
These four features of RSI often come together to create a high-probability buy or sell signal. Thus, a stock may go over 70, create bearish divergence, form a descending triangle top, and then complete a failure swing. These signals often predict the signal on the price chart.
5) A final use of RSI mentioned in Wilder’s book, New Concepts in Technical Analysis, is that “trendlines on the bar chart often show up as support lines on RSI.”
A corollary of this point, not mentioned by Wilder, is that the RSI line itself can be interpreted by trendline analysis. A break in the RSI trendline can provide a signal that often predicts action on the price chart.
The chart of the Nasdaq below shows the price chart superimposed on the RSI indicator. A trendline is drawn under the RSI line. When the RSI trendline breaks, it will be an advance warning that the Composite is vulnerable to a sharp fall.
RSI trendlines and support levels supplement the four major tenets of RSI analysis. Together, these five applications of RSI can give traders valuable lead time to take advantage of a pending trend reversal.